SomeCharts
This project is open source: https://github.com/firedef/SomeCharts
The library is not in the release state. Some functionality can be changed, some hardcoded and some bugs may appear.
Description
SomeCharts is a fast cross-platform C# library for data visualisation. Current backend uses Avalonia and OpenGl, but can been ported to any environment.
Problem
There are some alternative libraries:
But all of them have different downsides. For example, they are extremely slow. So i’m tried to make possible to plot huge amount of data.
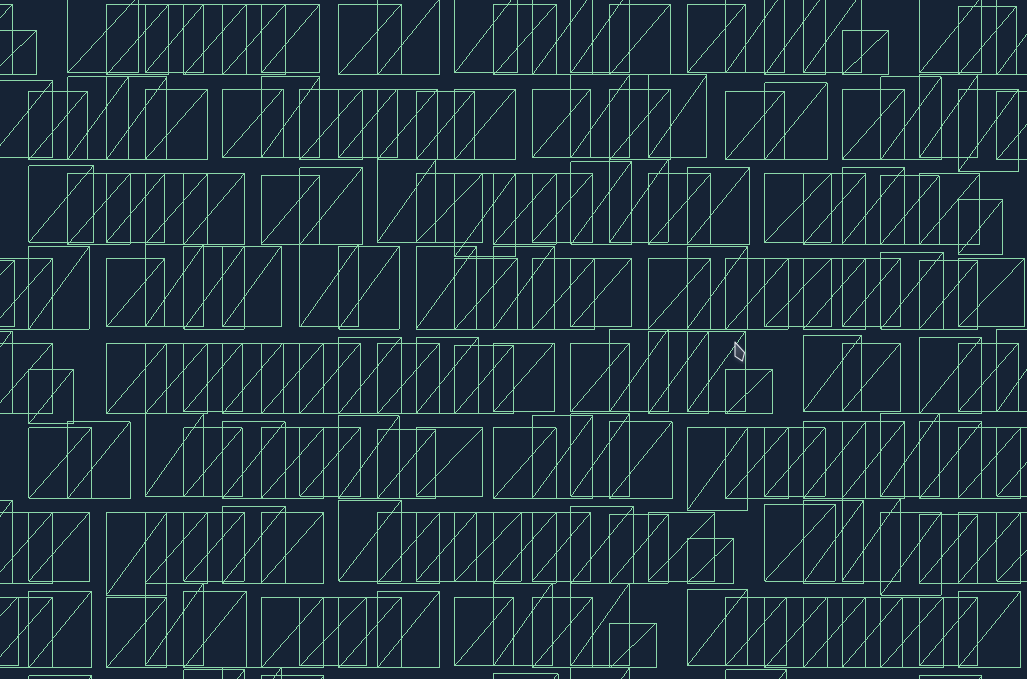
SomeCharts is using (almost) raw OpenGl. All charts are constructing to meshes which can be rendering very efficiently. Levels of detalisation and 2D frustum culling removes non-visible elements. Lot’s of code is unsafe (pointers, stack allocations, etc.) which reduces garbage.
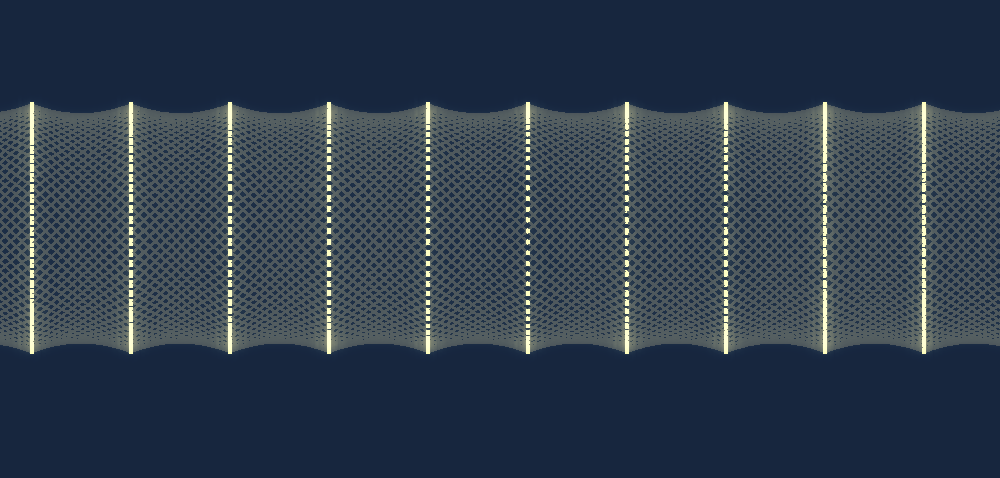
Text rendering
SomeCharts uses custom text rendering. Library FreeType uses for texture generation from font chars. Generated textures are packed into texture atlases to reduce state changes (improve performance).
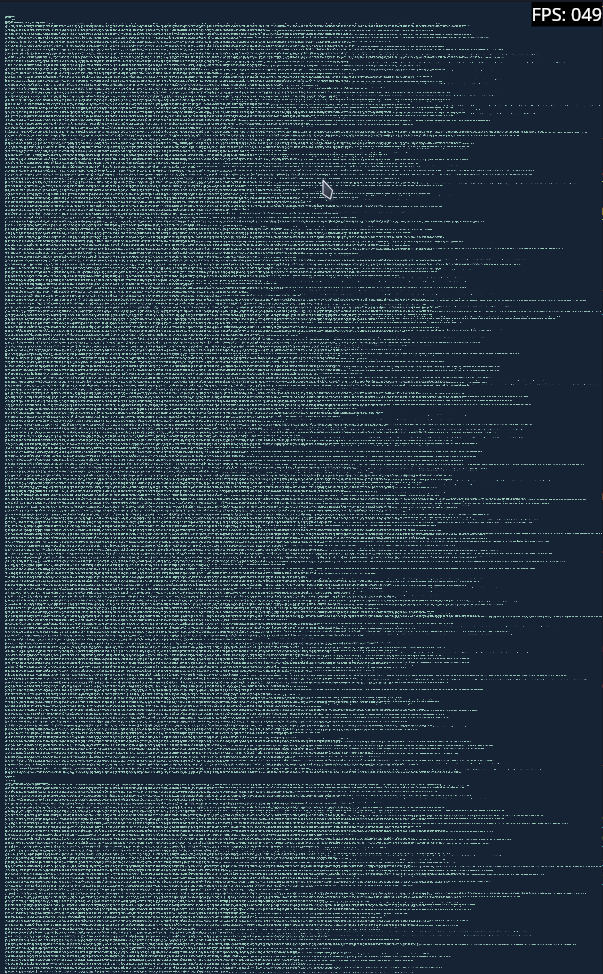 |
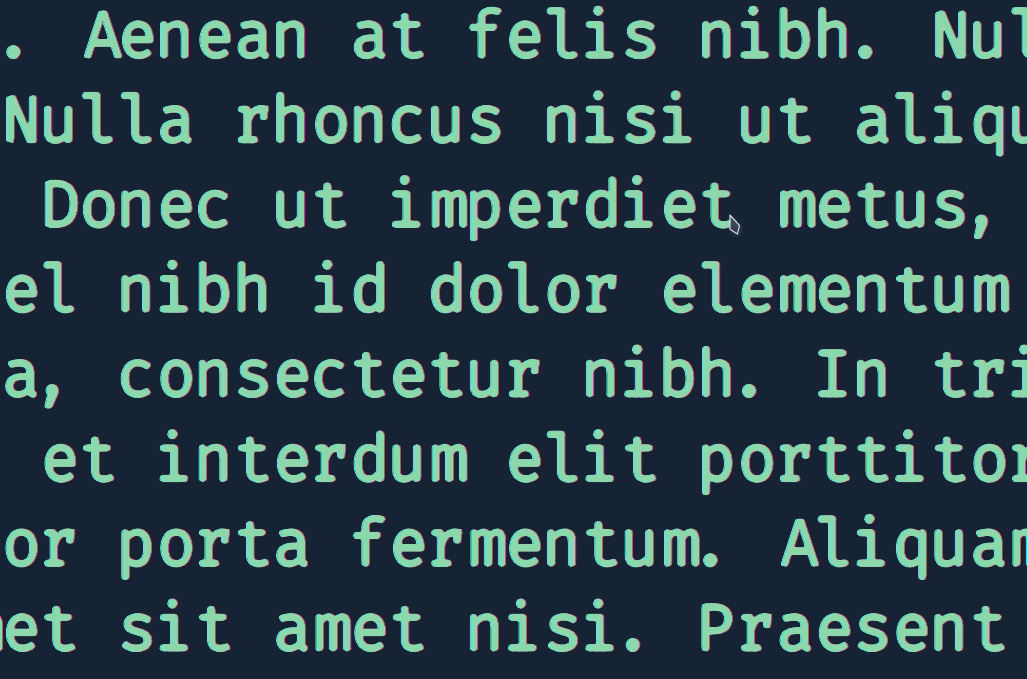
2.7mb Utf-8 text file (2.7 million characters!). The most of text are not fitting to screen. Rendering at almost 60 fps and mesh building in ~5 sec. No downscales or levels of detalisations are using in text rendering |
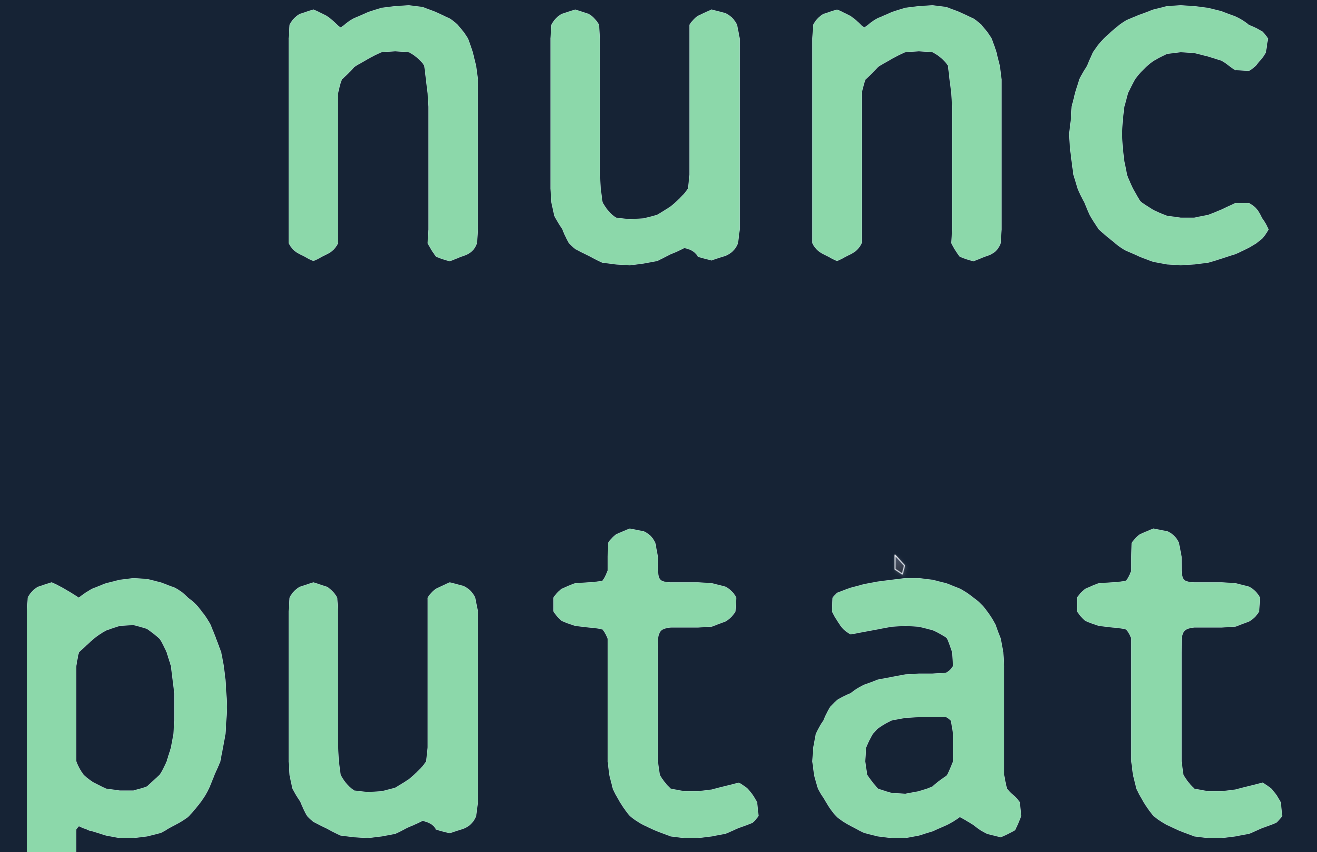 |
SDF rendering preserve detail on big scale. The resolution is equal or less then 32x32 per character. There are no pixels, but text can looks wry on small resolutions. |
Unicode and different fonts is supported. Texture atlas is dynamic so chars are adding on demand. When atlas overflowing, new atlas creates.
Signed distance field text shaders are complicated. Simple SDF rendering:
float sample(vec2 coord, float gammaAdd) {
	float dist = texture2D(texture0, coord).r - u_gamma - gammaAdd;
	return gain(dist / fwidth(dist) + u_gamma + gammaAdd, 2);
}
There are LCD (subpixel) attempt. LCD samples text on subpixels of screen. LCD rendering can be toggle by key [L]. Current version increases contrast, but result looks ugly in some cases. Full text shader can be found here: fragment and vertex
Charts
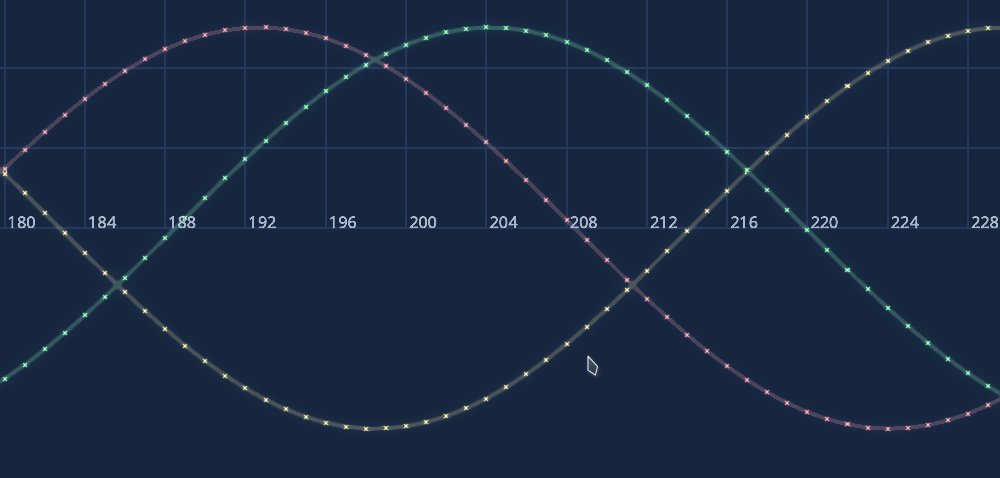
Line chart
| Simple line chart | 10K different lines at runtime (~5 fps) |
 |
 |
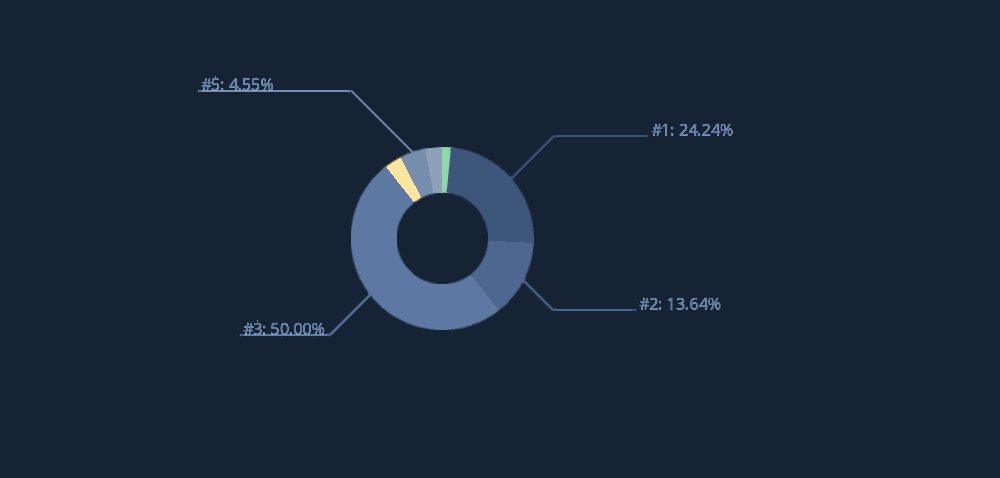
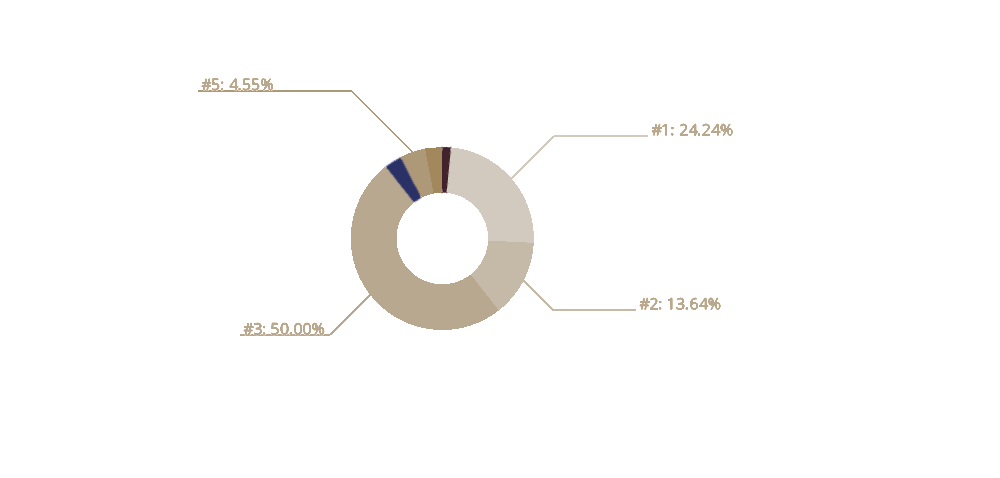
Pie chart
| Dark theme | Light theme |
 |
 |
Scatter chart
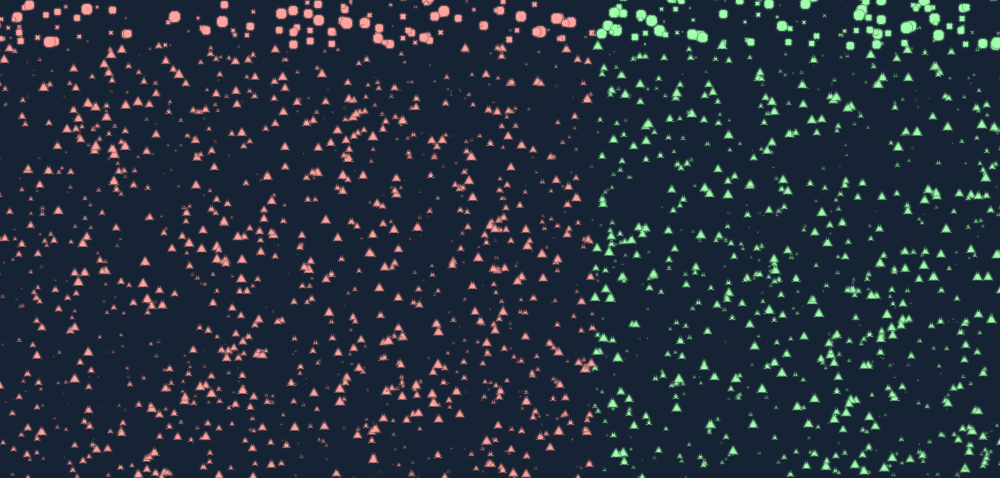 |
Render items with different shapes, sizes, colors and positions |
Heatmap
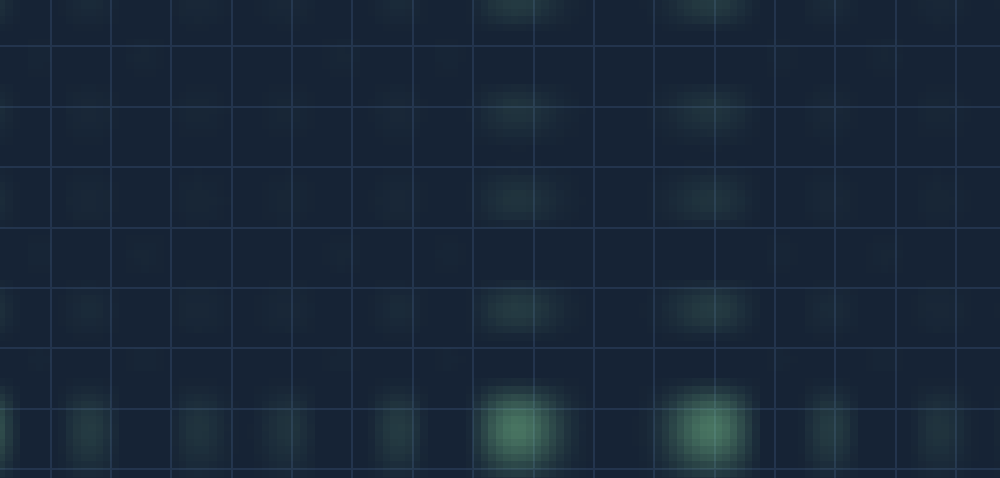 |
Renders cells at different meshes to handle lot’s of vertices and support multithreading. |
Mesh
 |
SomeCharts can render mesh from .obj files |
Data
SomeCharts uses interfaces to handle different data types. By default, data can be applied as functions, arrays, ienumerable and constants.
const int lineLength = 81920;
IChartData<float> data = new FuncChartData<float>(j => LineChartFunc(j, i * 10), lineLength);
IChartData<indexedColor> colors = new ConstChartData<indexedColor>(color);
LineChart chart = canvas.AddLineChart(data, colors);
Examples
Examples can be found there